

SQL Server performance tuning: Find the cause. Fix what matters.
SQL Server slow? Performance optimization is our daily business: we pin down the cause with evidence, implement the most effective change or support your team in doing so, and measure the effect afterward. Urgent, targeted or ongoing.
Prefer to check for yourself first? To the performance guide with SQL queries →
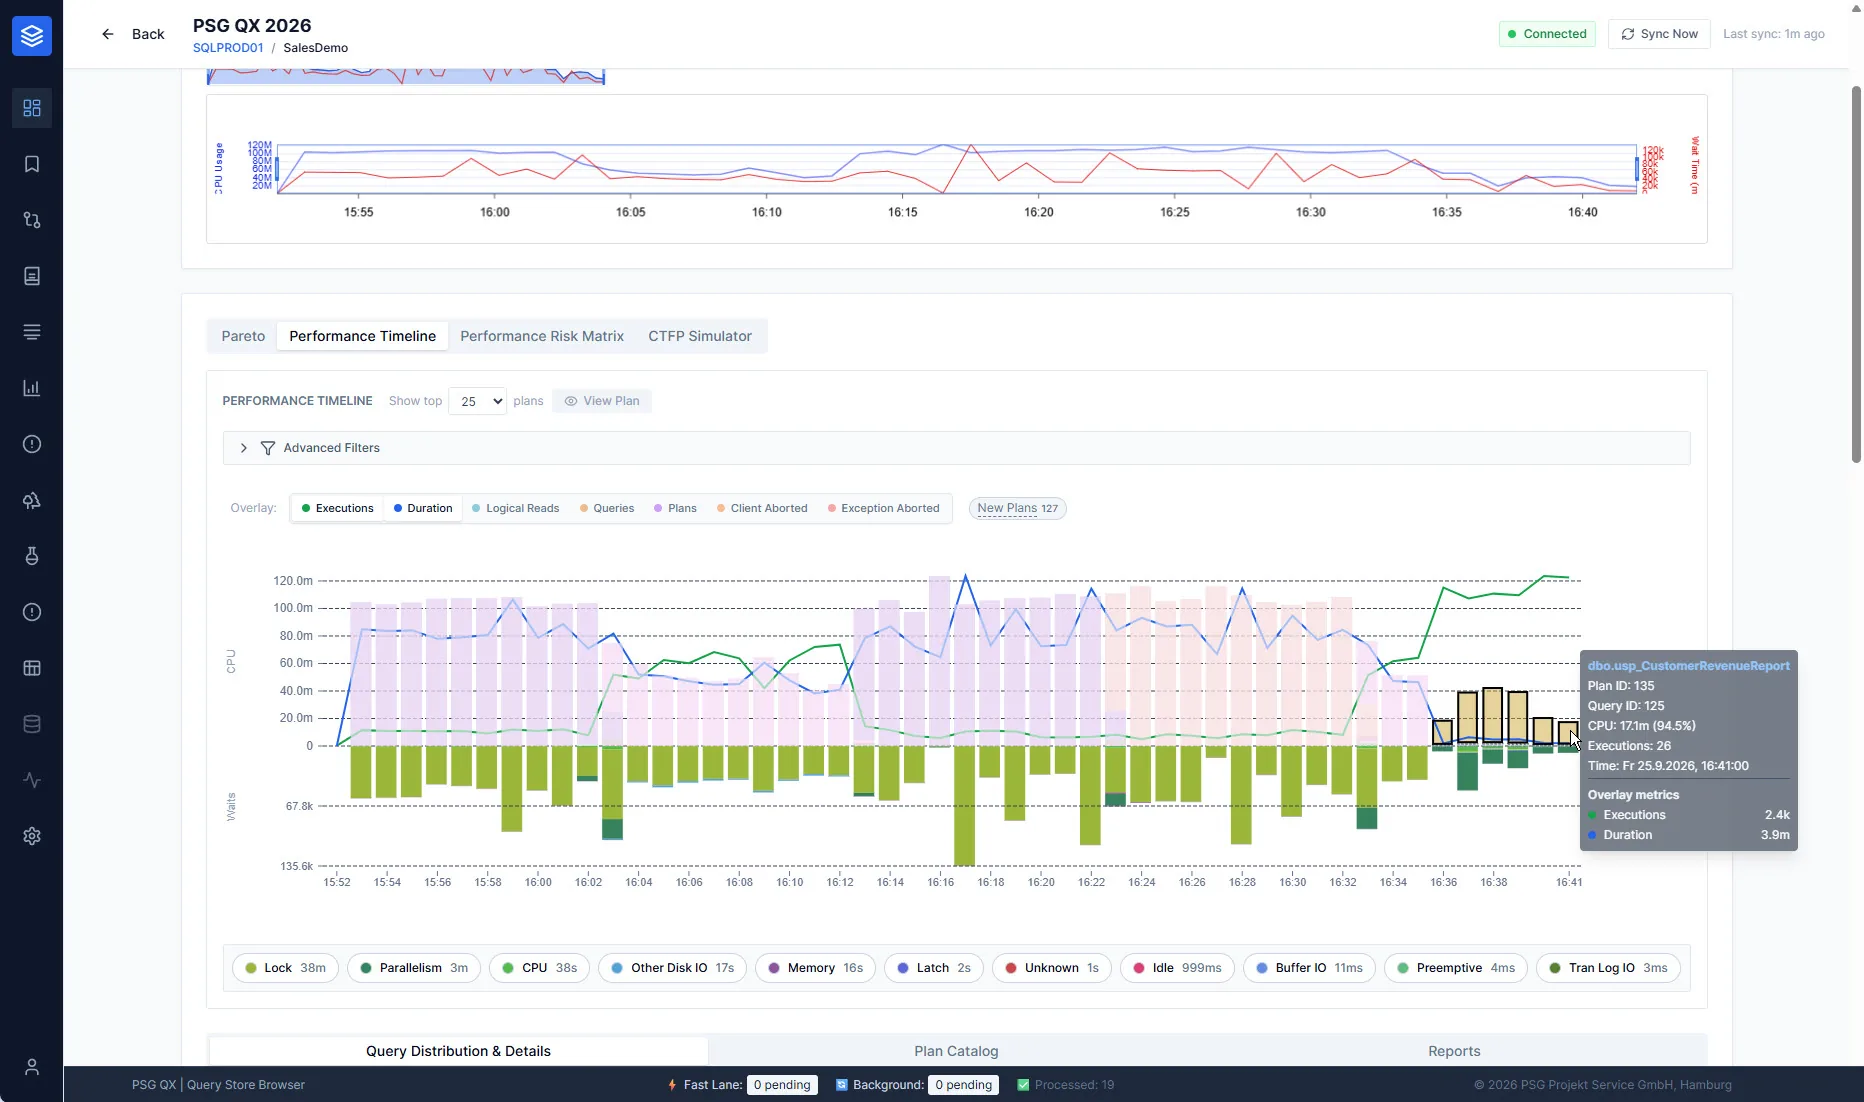
Typical performance problems
Slow after an update or migration
Since an update, a server move or a configuration change, routine operations take noticeably longer.
Sporadic hangs
The application barely responds at times. By the time someone looks, the problem is already over.
High CPU or I/O load
Resources are heavily utilized, and neither more users nor larger data volumes explain the load.
Blocking and deadlocks
Sessions wait on each other; operations end in timeouts or aborted transactions.
Jobs exceed their time window
Maintenance, imports or reports no longer finish in time.
More hardware, no noticeable effect
Additional cores, more RAM or faster storage have barely improved response times.
Four paths to performance optimization.
To us, optimization means proving the cause first, then changing selectively and measuring the effect. Where you start depends on your situation.
Performance Troubleshooting
Help at short notice, narrow down the cause, agree on immediate actions.
More → TargetedPerformance analysis
Investigate in a structured way and deliver prioritized recommendations.
More → ImplementationPerformance Tuning
Implement changes, deploy them with a way back and measure the effect afterward.
More → OngoingPSG MX
Continuous performance engineering within the agreed scope.
More →When something is on fire, a reliable trail is what counts.
We support you at short notice, often already via a Teams or Zoom session with a shared screen. Stabilize first, then prove the cause so that the problem does not come back.
“What impresses me about working with PSG, besides the exceptional, field-proven expertise, is above all the ability to get support at short notice.”
- Assess the situation
What is affected, since when, what changed most recently? - Narrow it down
Look at wait times, blocking, plans and resources in the running system. - Immediate actions
Agreed with you and with a clear way back. - Prove the cause
Secure evidence so that the actual cause can be fixed. - Finding
Briefly documented: what was going on, what was done, what is still open.
Investigate in a structured way, recommend in order of priority.
Do you want the whole system checked, not just the performance? Then the SQL Server Health Check is the right path. The performance audit is one of its variants.
- 01
Case history
Understand the application, its usage, anomalies and the actions taken so far.
- 02
Configuration
Check instance, databases, storage and maintenance for plausibility.
- 03
Metrics
Read wait times, resources and trends in context.
- 04
Workload & plans
Examine the most expensive and most conspicuous queries and their execution plans.
- 05
Recommendations
Prioritized, justified and with a way to verify the effect.
case history   Response times at month-end close much worse than during the rest of the month.
configuration  Parallelism and memory plausible, statistics maintenance irregular.
metrics        Wait times mostly from reading large amounts of data.
workload       A few reporting queries cause most of the load.
plans          Missing filtering before a large join, unfavorable estimate.
recommendation Test an index and a query change, compare the effect at the next close.
Change what works. And prove that it works.
A recommendation only counts once it has been implemented and its effect has been established. After your approval, we apply changes ourselves or support your team and the vendor in doing so. We measure afterward in every case.
No proven causes yet? Then tuning begins with a performance analysis or a performance audit.
- 01
Change plan
Order actions by expected effect, risk and effort. One change after another, so that each effect can be attributed.
- 02
Test
Check on a test system or with a comparable load: same result, expected plan, no side effects on other queries.
- 03
Deploy with a way back
After your approval, in the agreed window, by us or by your team. The way back is settled beforehand.
- 04
Measure afterward
Compare the same processes before and after the change: runtime and resource consumption of the affected queries, plus side effects on others.
- 05
Record
What was changed, why and with what effect, so that operations and development can trace it later.
Six levers, one sequence.
Most performance problems are solved in the workload, not in the hardware. That is why we work our way from the query to the platform and change the hardware only once the workload is efficient.
Queries & code
Unfavorable patterns such as row-by-row processing or functions applied to columns in filter conditions. A small rewrite often achieves more than any index.
Indexes & statistics
Missing, duplicate or unused indexes, outdated statistics. Every additional index costs something on writes, so we check suggestions against the whole workload. Choosing the right index →
Plans & parameters
The same query, a different plan: parameter sniffing, estimation errors, plan changes after updates. We stabilize selectively instead of pinning plans across the board.
Understanding the optimizer →Parallelism & configuration
MAXDOP and cost threshold matched to the workload, plus memory and tempdb. The goal is a shorter runtime with efficient CPU use, not a smaller wait-time statistic.
Gate and width →Locking & concurrency
Blocking, deadlocks and long transactions. We adjust isolation levels, access order and transaction boundaries together with development.
Platform & resources
If the workload is efficient and it still is not enough: size CPU, memory and storage appropriately, and choose edition and cores deliberately.
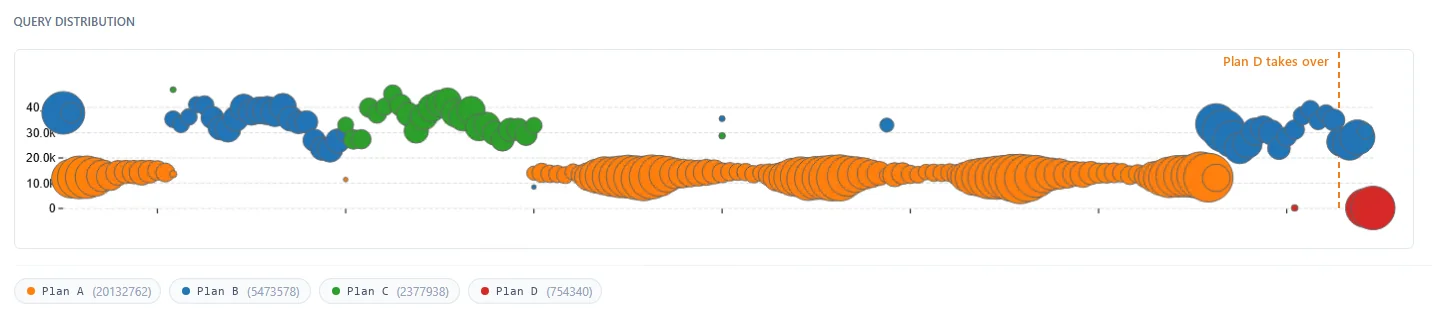
Edition & cores →The statistics were right. An old plan stood in the way.
A central list view of a business-critical application responded sluggishly. What we found, changed and measured, without changing a single line of the application's code.
- Starting point
The list calls a function millions of times. On average each call cost around 15 milliseconds, which adds up over the day to noticeable waiting time for users. - First attempt
A filtered statistic was meant to help the optimizer make better estimates. It was in place first in test, then in production. Nothing changed in the measurements. - Finding
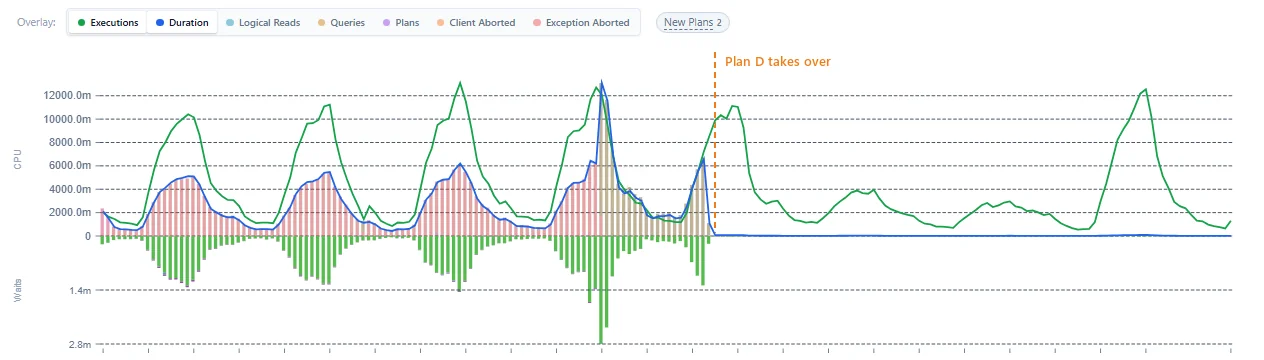
For the query, a plan had been forced in Query Store for a long time. When and why could no longer be reconstructed. The forcing prevented the optimizer from using the new statistic. - Change
Forcing removed and the workload observed. The optimizer found a much better plan but occasionally fell back to an old one. Based on the execution history, the customer's team then deliberately forced the new plan after consultation. - Effect
Mean runtime of the function down from about 15 to 0.2 milliseconds, compared over more than 8 million and just under 590,000 executions.
What we take from this: plan forcing is a tool, not a permanent state. We document it and review it regularly. Changes to forced plans can be tracked with an Extended Event. If the new plan does not hold, an index on the filter predicate remains as an alternative.
Continuous performance engineering.
For applications where performance is business-critical. We observe, investigate, improve and verify the effect, month after month and within the agreed scope.
At least three months as MX-Intensive to start, then ongoing as MX-Care. With MX AIOps and PSG QX, which run in your environment and do not sync any data to a public cloud.
Why performance stability has to be managed continuously is explained on our page for decision-makers: When will our SQL Server run reliably again?
- Analysis & goal setting
Define together what “good” means for your application. - Data collection
Continuous and local, with MX AIOps. - Optimization & reporting
Prioritized actions and their measured effect. - Knowledge transfer
So that your team understands the connections.
Evidence instead of gut feeling.
For more than ten years we have been developing our own tools and continuously revising them to deliver even better insights.
PSG QX
Analyzes the execution history: which query, which plan, since when, and what a change actually achieved.
QX Recorder
Captures the evidence of sporadic problems. If the problem occurs at night, the data is there in the morning.
MX AIOps
Collection and evaluation for continuously supported environments, with traceable rules and statistical methods.
Answered briefly.
What does SQL Server performance optimization involve?
We work in four steps: establish the cause with measurements, select the most effective changes to queries, indexes, plans or configuration, deploy them tested and with a way back, and measure the effect afterward. More hardware only comes into question once the workload is efficient.
Can we optimize performance ourselves?
Often at least the first part. Our performance guide shows six diagnostic paths with read-only SQL queries that you can use to narrow down the cause yourself. Once the finding is established but you lack the time, evidence or experience to implement it, we step in at that point.
Doesn't more hardware simply help?
Sometimes. Often, though, additional hardware only postpones the problem or makes it more expensive. If the cause lies in queries, plans, indexes or data access, a targeted change usually helps more sustainably.
Do you need access to our systems?
Not necessarily. For quick help, a Teams or Zoom session is often enough: you share your screen, we look together and give you the decisive nudge in the right direction. Our analysis tools run locally in your environment.
We already have monitoring. Why PSG, then?
Monitoring shows that something is conspicuous. We clarify why, and what the most effective change is. We are glad to use existing data from your monitoring as a starting point.
Do you work together with the software vendor?
Yes. If the cause lies in the application, we coordinate findings and actions with you and the vendor.
Do you implement the changes yourselves?
Depending on the arrangement. We apply changes ourselves after your approval or support your team and the vendor in doing so. We take the follow-up measurements in both cases.
Should we simply implement SQL Server's index suggestions?
Better not without checking. The suggestions look at individual queries, not at the whole workload, and often overlap. Every additional index costs something whenever the data changes. We check which suggestions are worthwhile and consolidate them where possible.
How do you measure the effect?
We compare the same processes before and after the change, preferably using the execution history in Query Store: runtime and resource consumption of the affected queries, and possible side effects on others.
How is billing handled?
Depending on the arrangement, as a project, through a block of consulting hours or as an ongoing agreement with PSG MX. In the first conversation we clarify what fits your situation.
Keeping it fast.
Describe your problem to us.
For urgent problems, a phone call is best. In the first conversation we assess the situation and propose the next step.